
HDX Workbench Features
HDX Workbench is an established feature-rich software platform for the analysis of hydrogen/deuterium exchange (HDX) mass spectrometry data from Waters or Thermo instruments. Our software allows users to quickly calculate deuteration levels for peptides, it integrates intuitive visualization tools to provide everything you need to understand and report protein conformation in the presence of HDX.
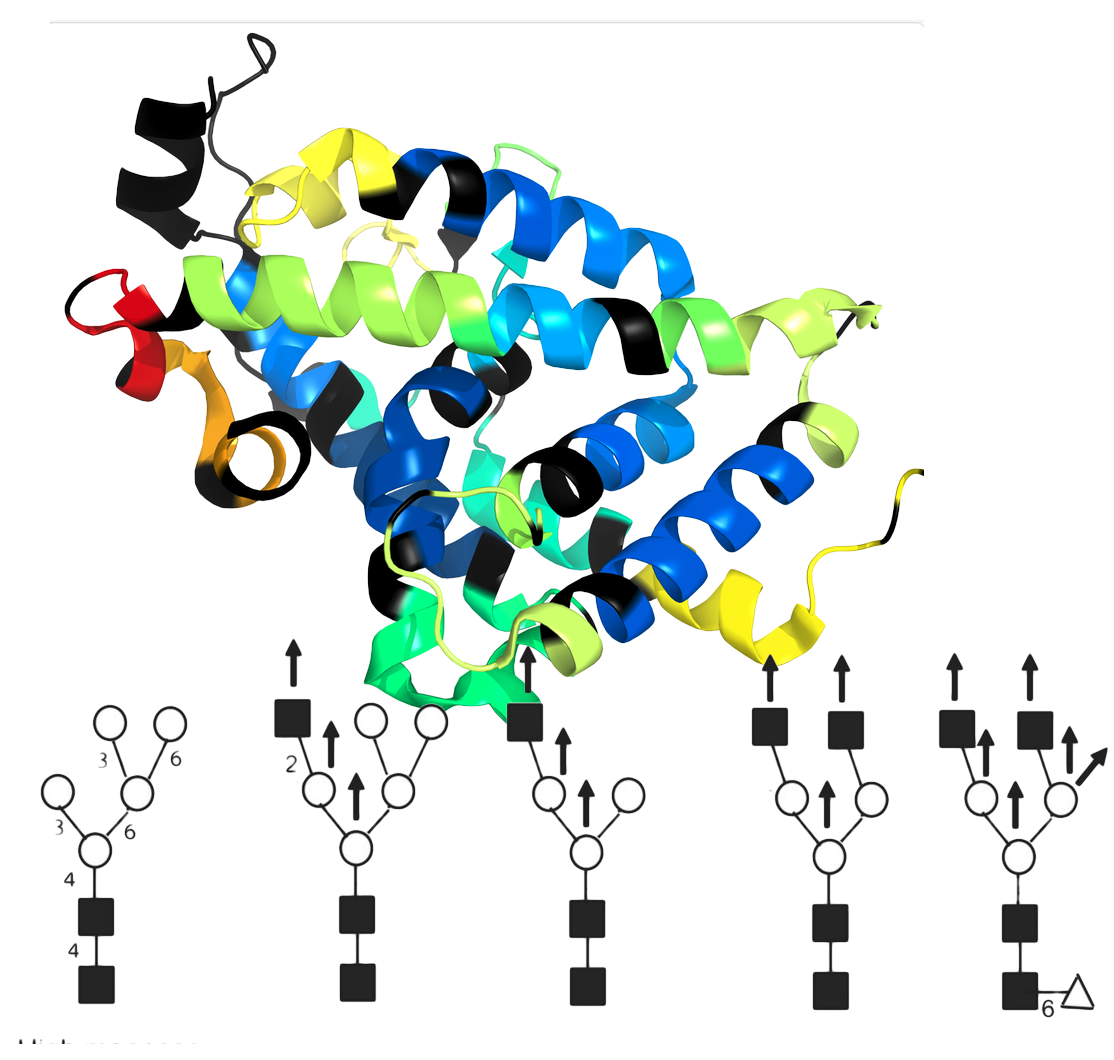
Glycan Modifications and HDX
Take advantage of an extensive glycan library to track hydrogen deuterium exchange (HDX) data at glycan sites. Accurately identify and analyze glycan interactions and dynamics, leveraging the retention of deuterium in acetamido groups within glycans. This enhances HDX-MS studies, providing detailed insights into glycoprotein structures and functions. Easily integrate and expand the glycan library for comprehensive, precise glycobiology research.
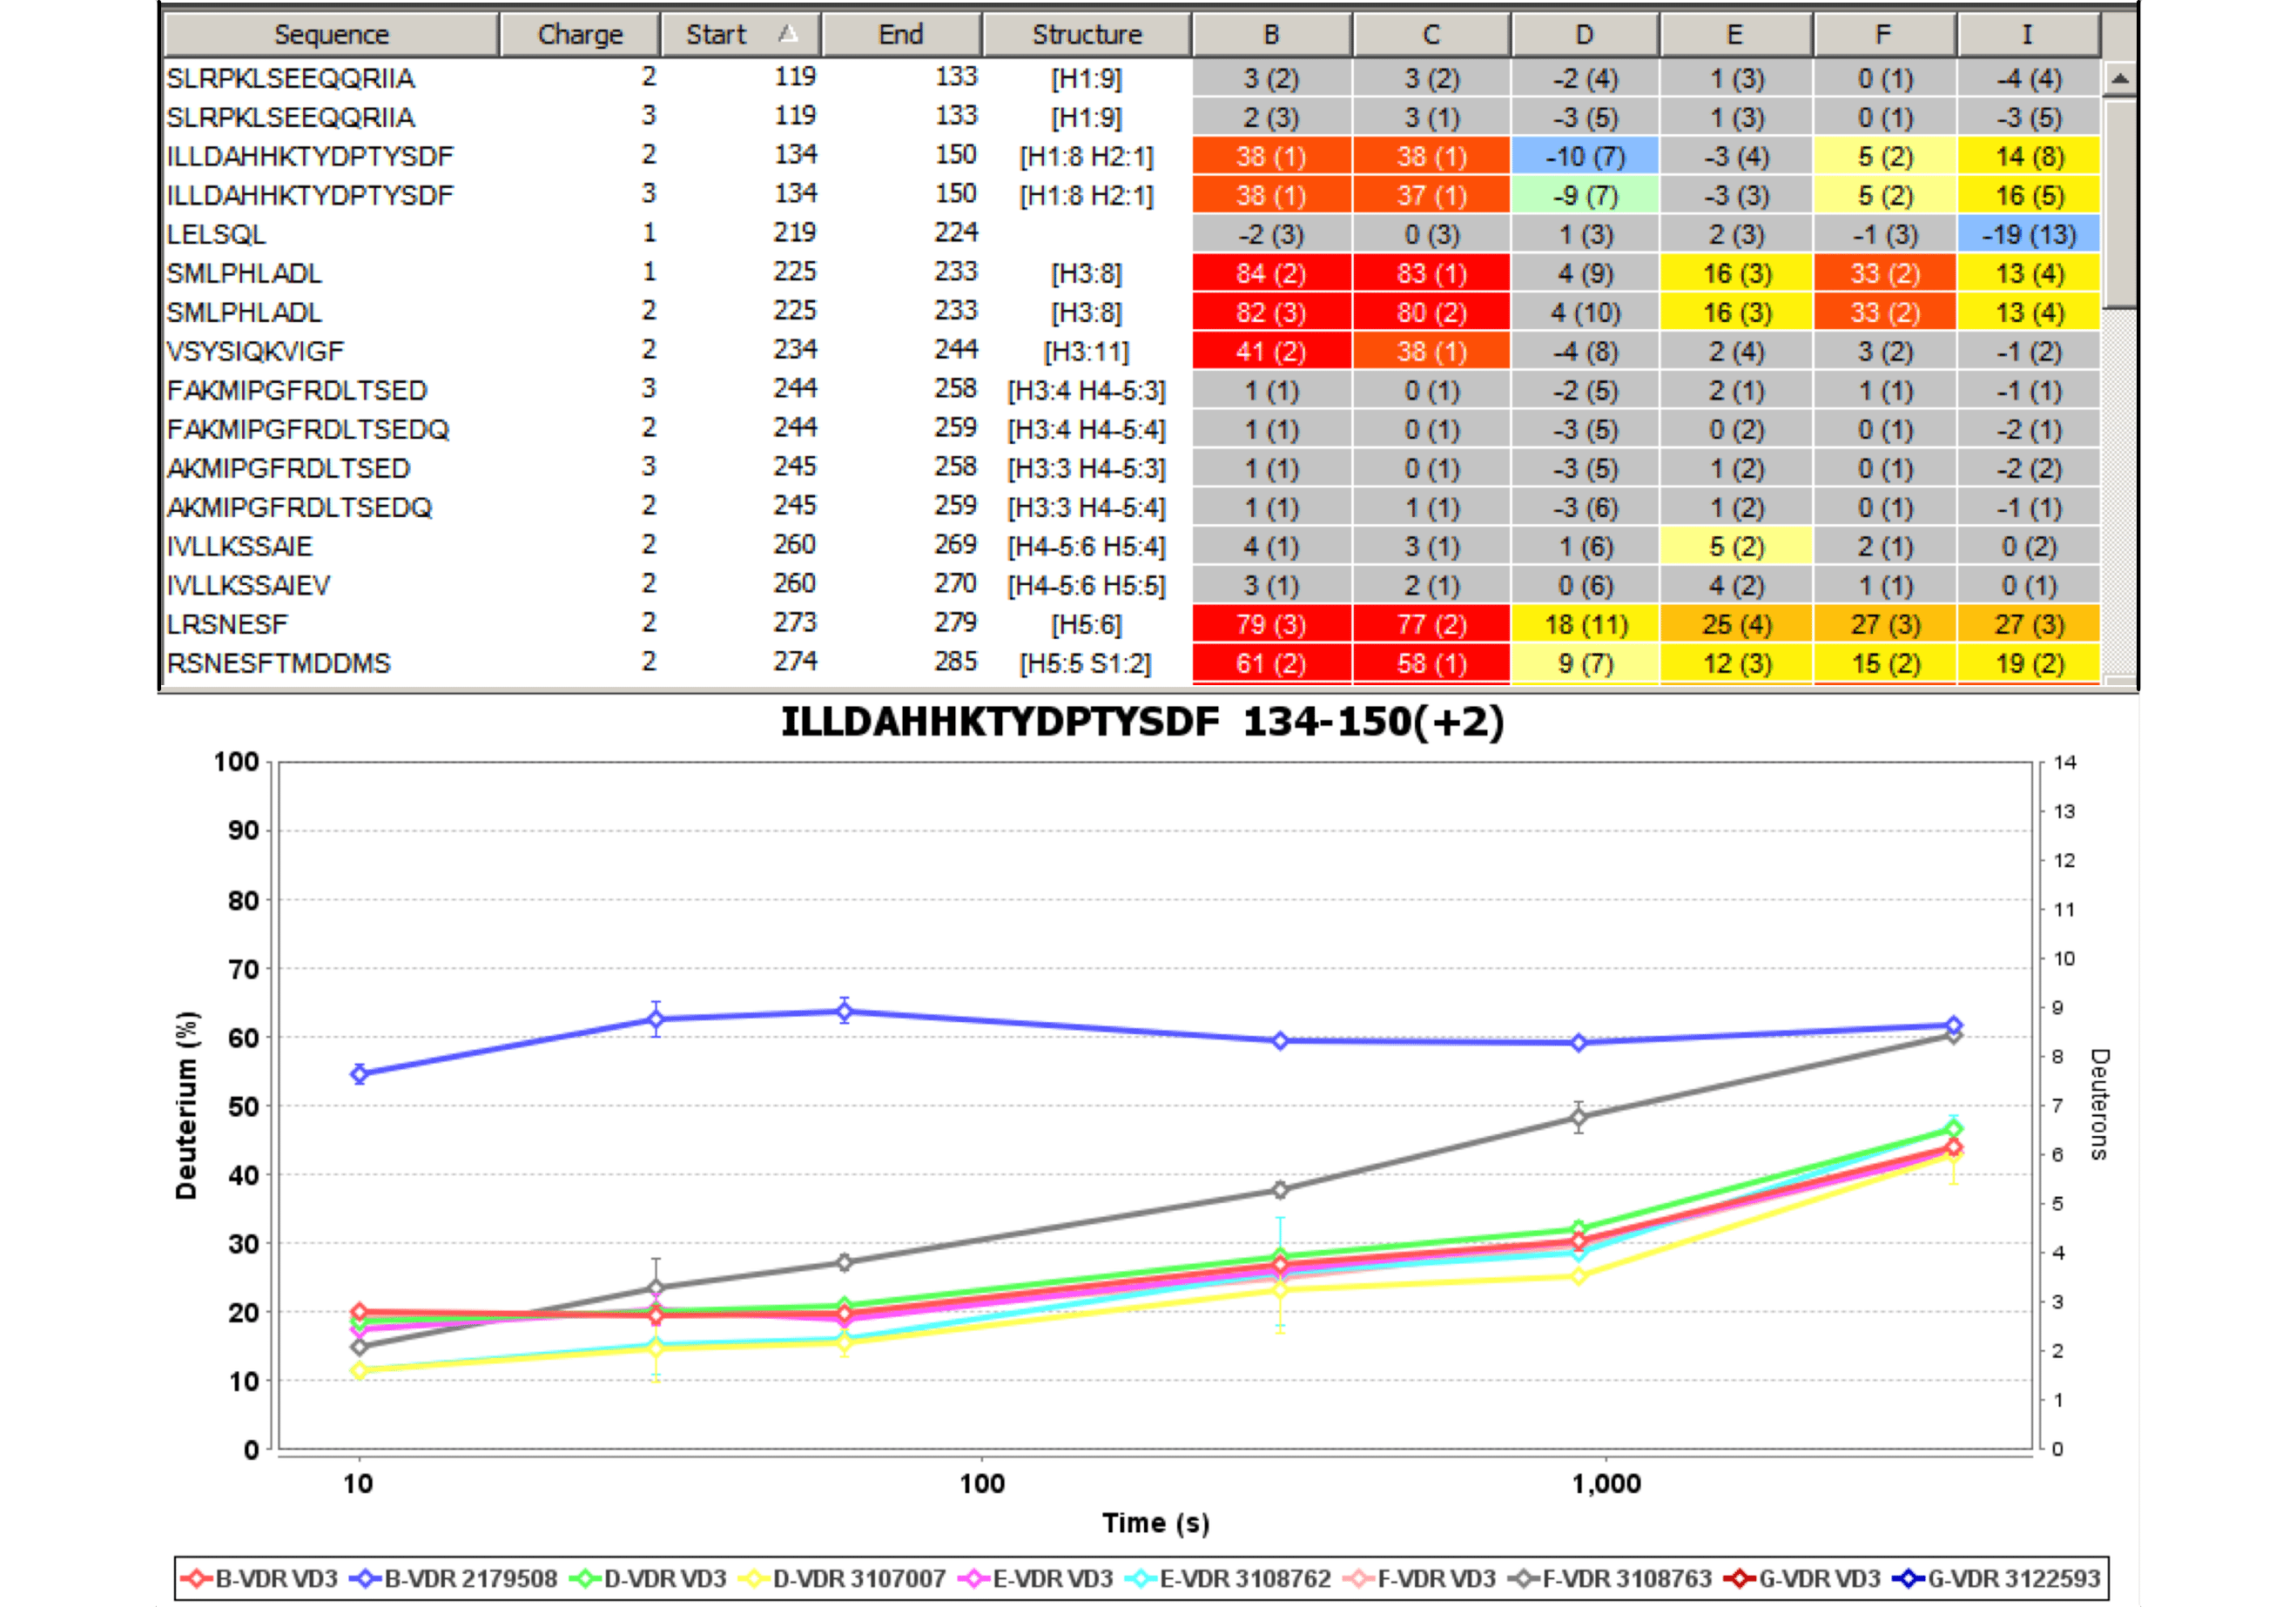
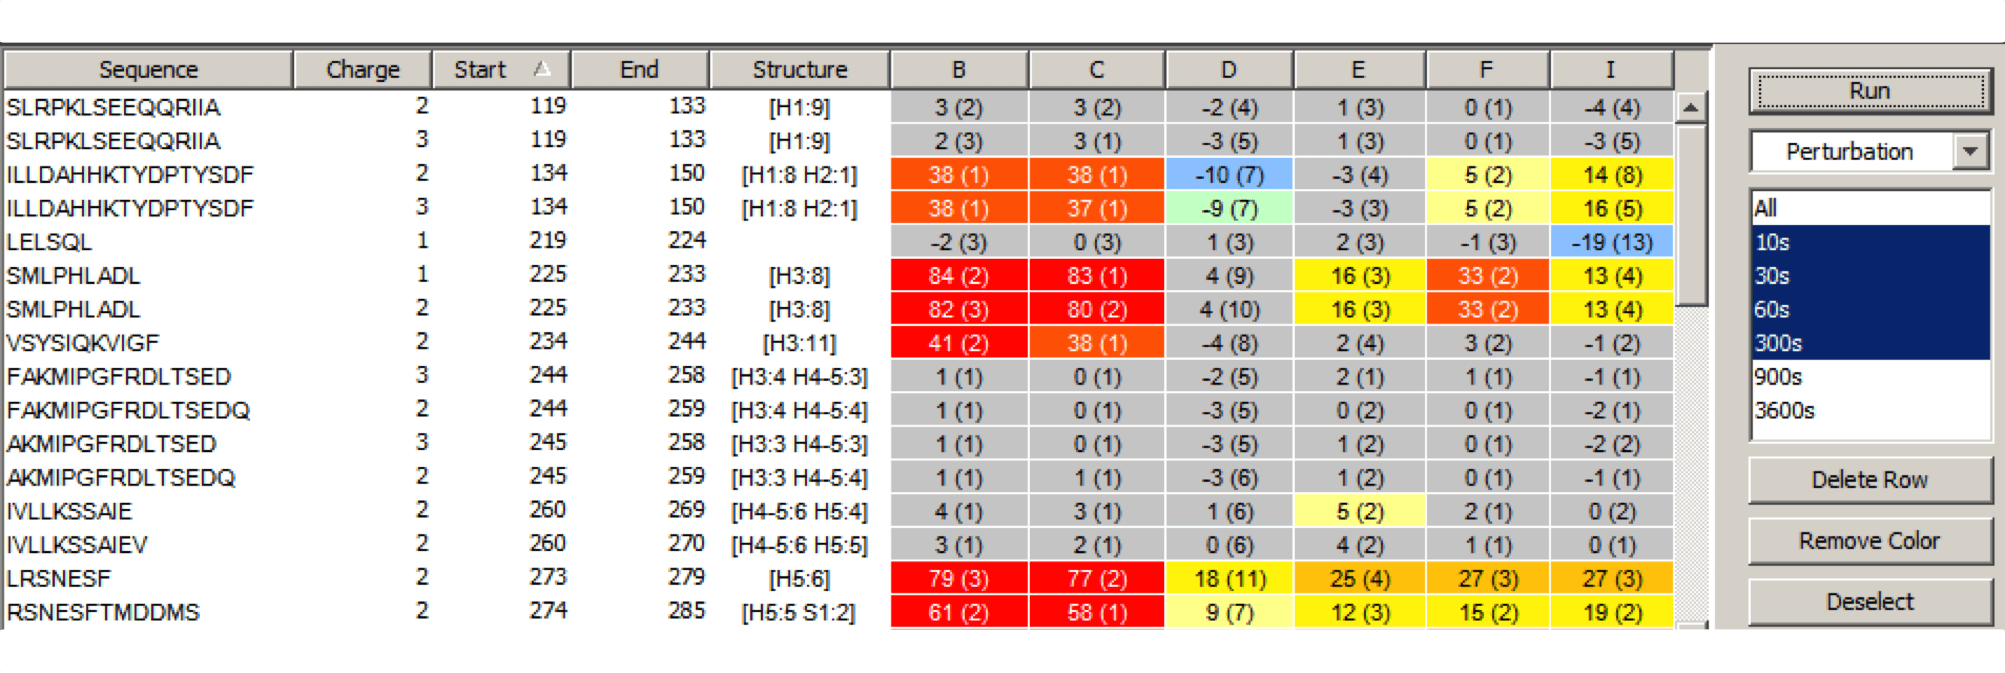
Experiment Comparison View
Cross compare result data from one or many experiments to show localized differences in protein conformation in a color coded table view. Show data from any combination of time points, delete rows, and group experiments according to similarity. Show underlying plots for any group of experiments. Export results as a table or a graphic.
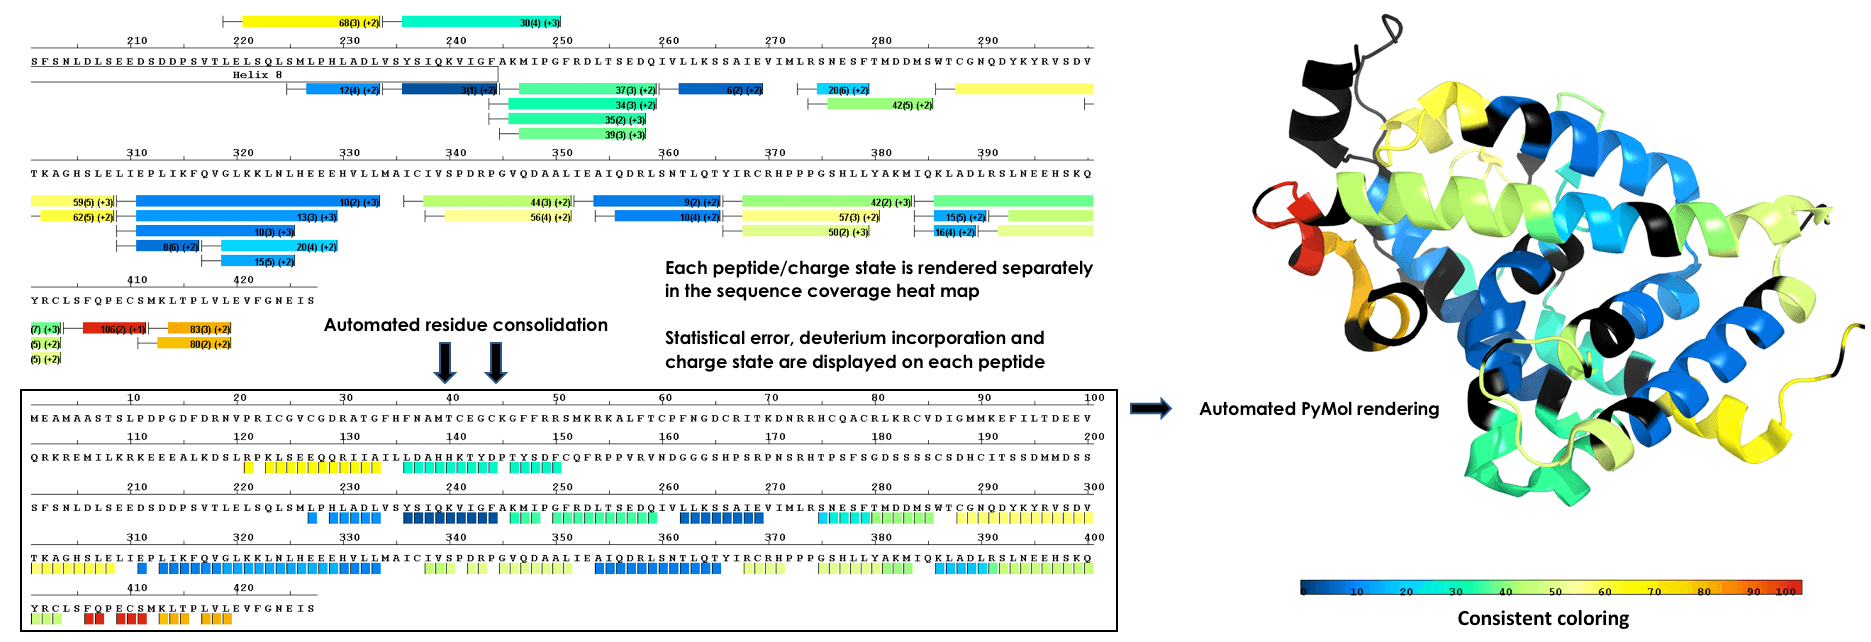
Render To Structure With a Single Click
Plot data from single amide resolution calculations onto a structure with a single click. Accurately represent data from all time points using established consolidation strategies. Avoid random selection of individual peptides or time points. Eliminate guesswork from 3D plots!
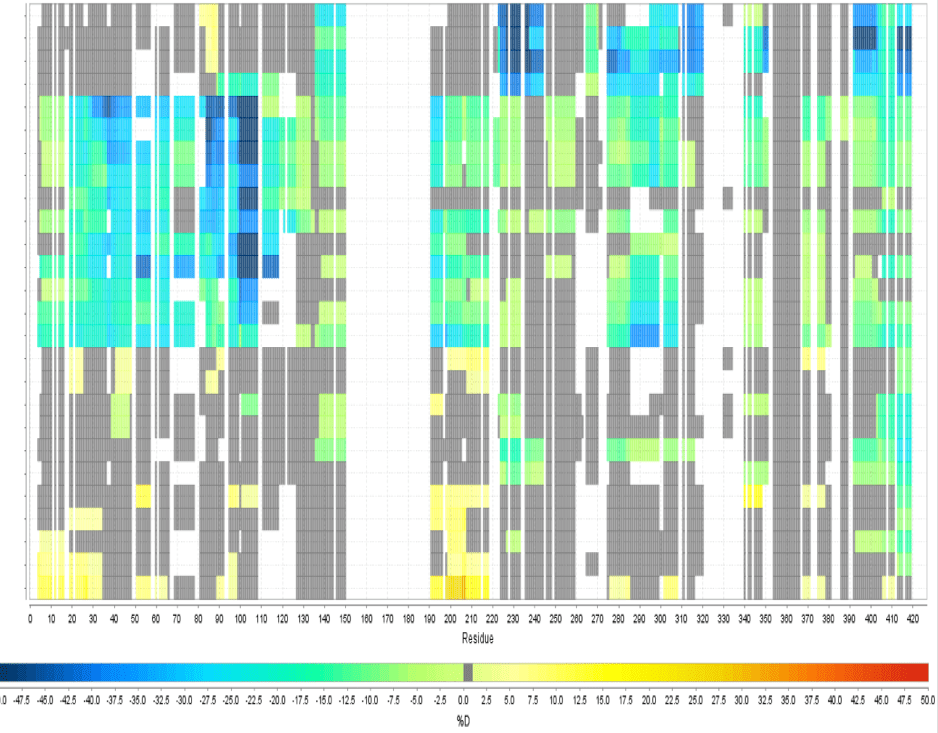
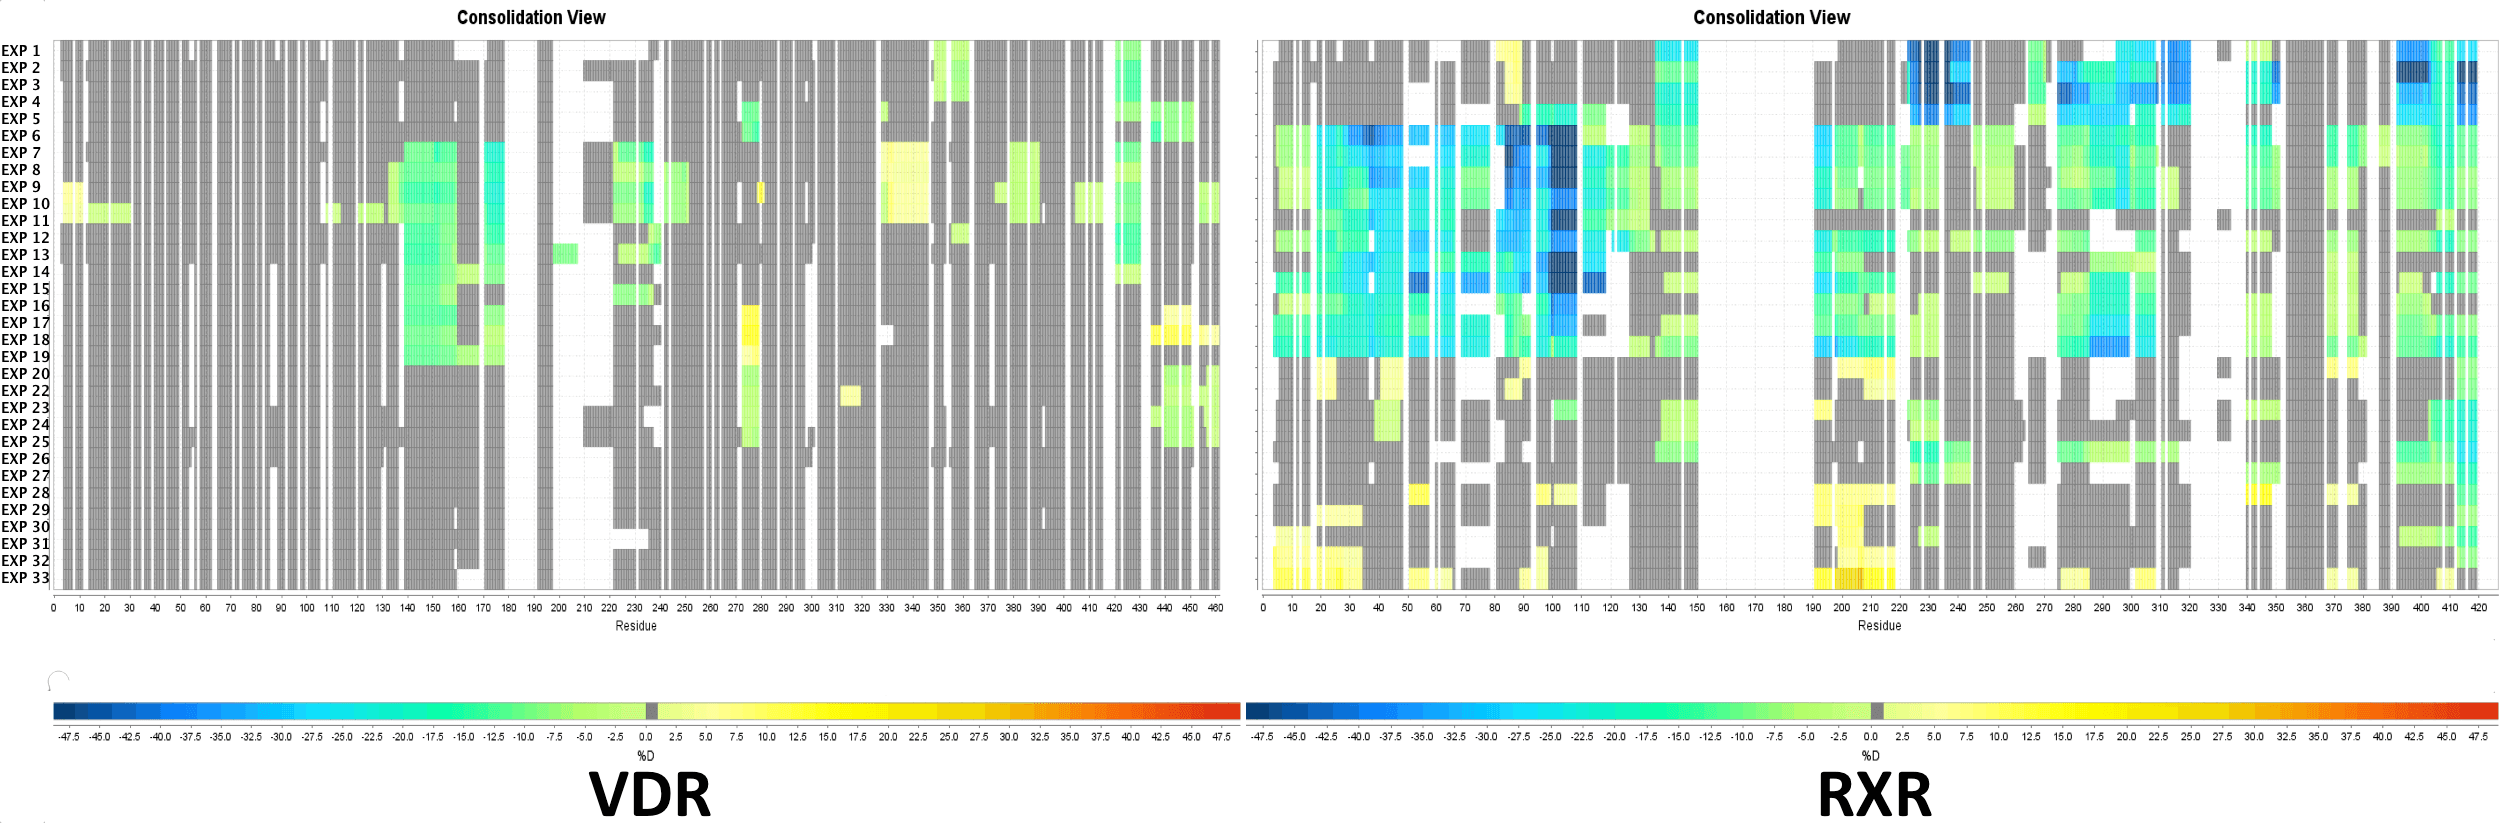
Multi Experiment Residue Consolidation
Visualize deuteration changes at the residue level across multiple experiments with our colored heat map. Easily compare differences between various states or differential experiments in any order you prefer. Define any pairwise comparison and see the results.
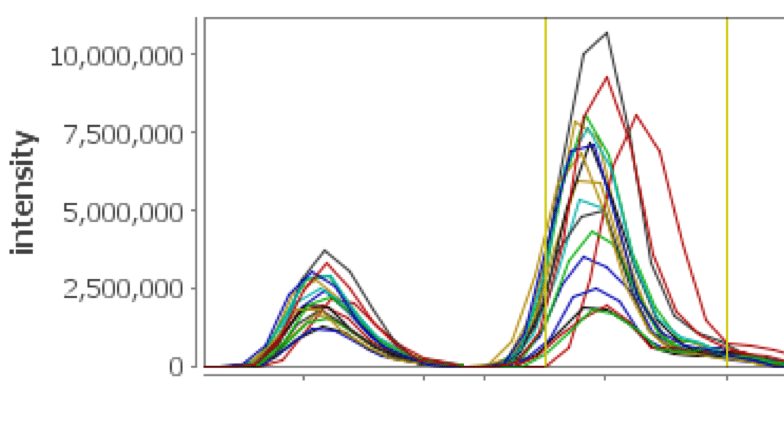
XIC on Steroids
See your XICs over multiple selected replicates color coded and displayed in a single view, facilitating validation of the peptide assignments and providing feedback regarding chromatographic consistency over several runs. Multiple mass ranges from peptide peak sub windows are used, providing more accurate and representative chromatographic peaks for the peptide of interest.
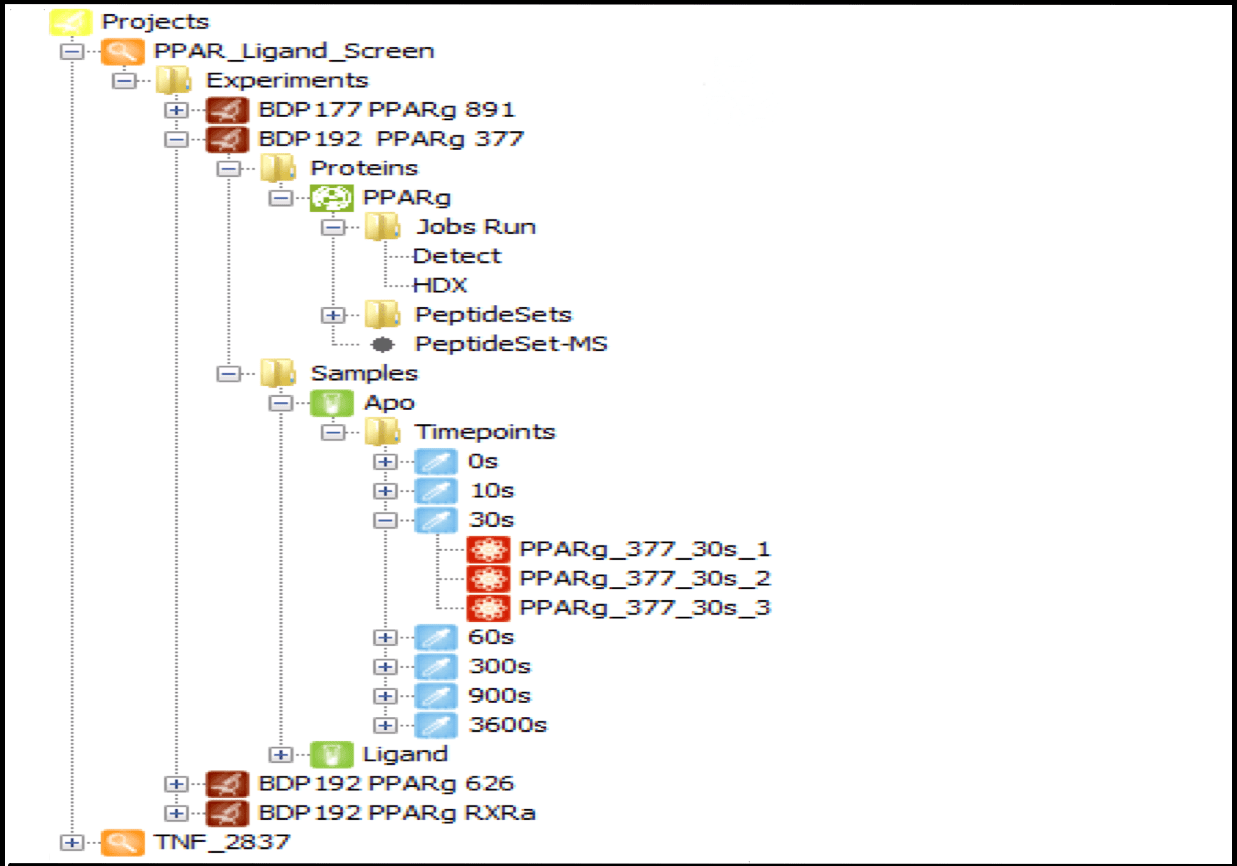
Data Management
Centralize all your data from multiple sources in one place, organized by project and linked to specific user logins. Projects can be shared among multiple users, with a wide range of contextual functions available from each tree node, such as launching detection jobs, editing experiment and protein information, and loading result data. As the number of user experiments grows, this feature becomes indispensable for managing HDX data efficiently.
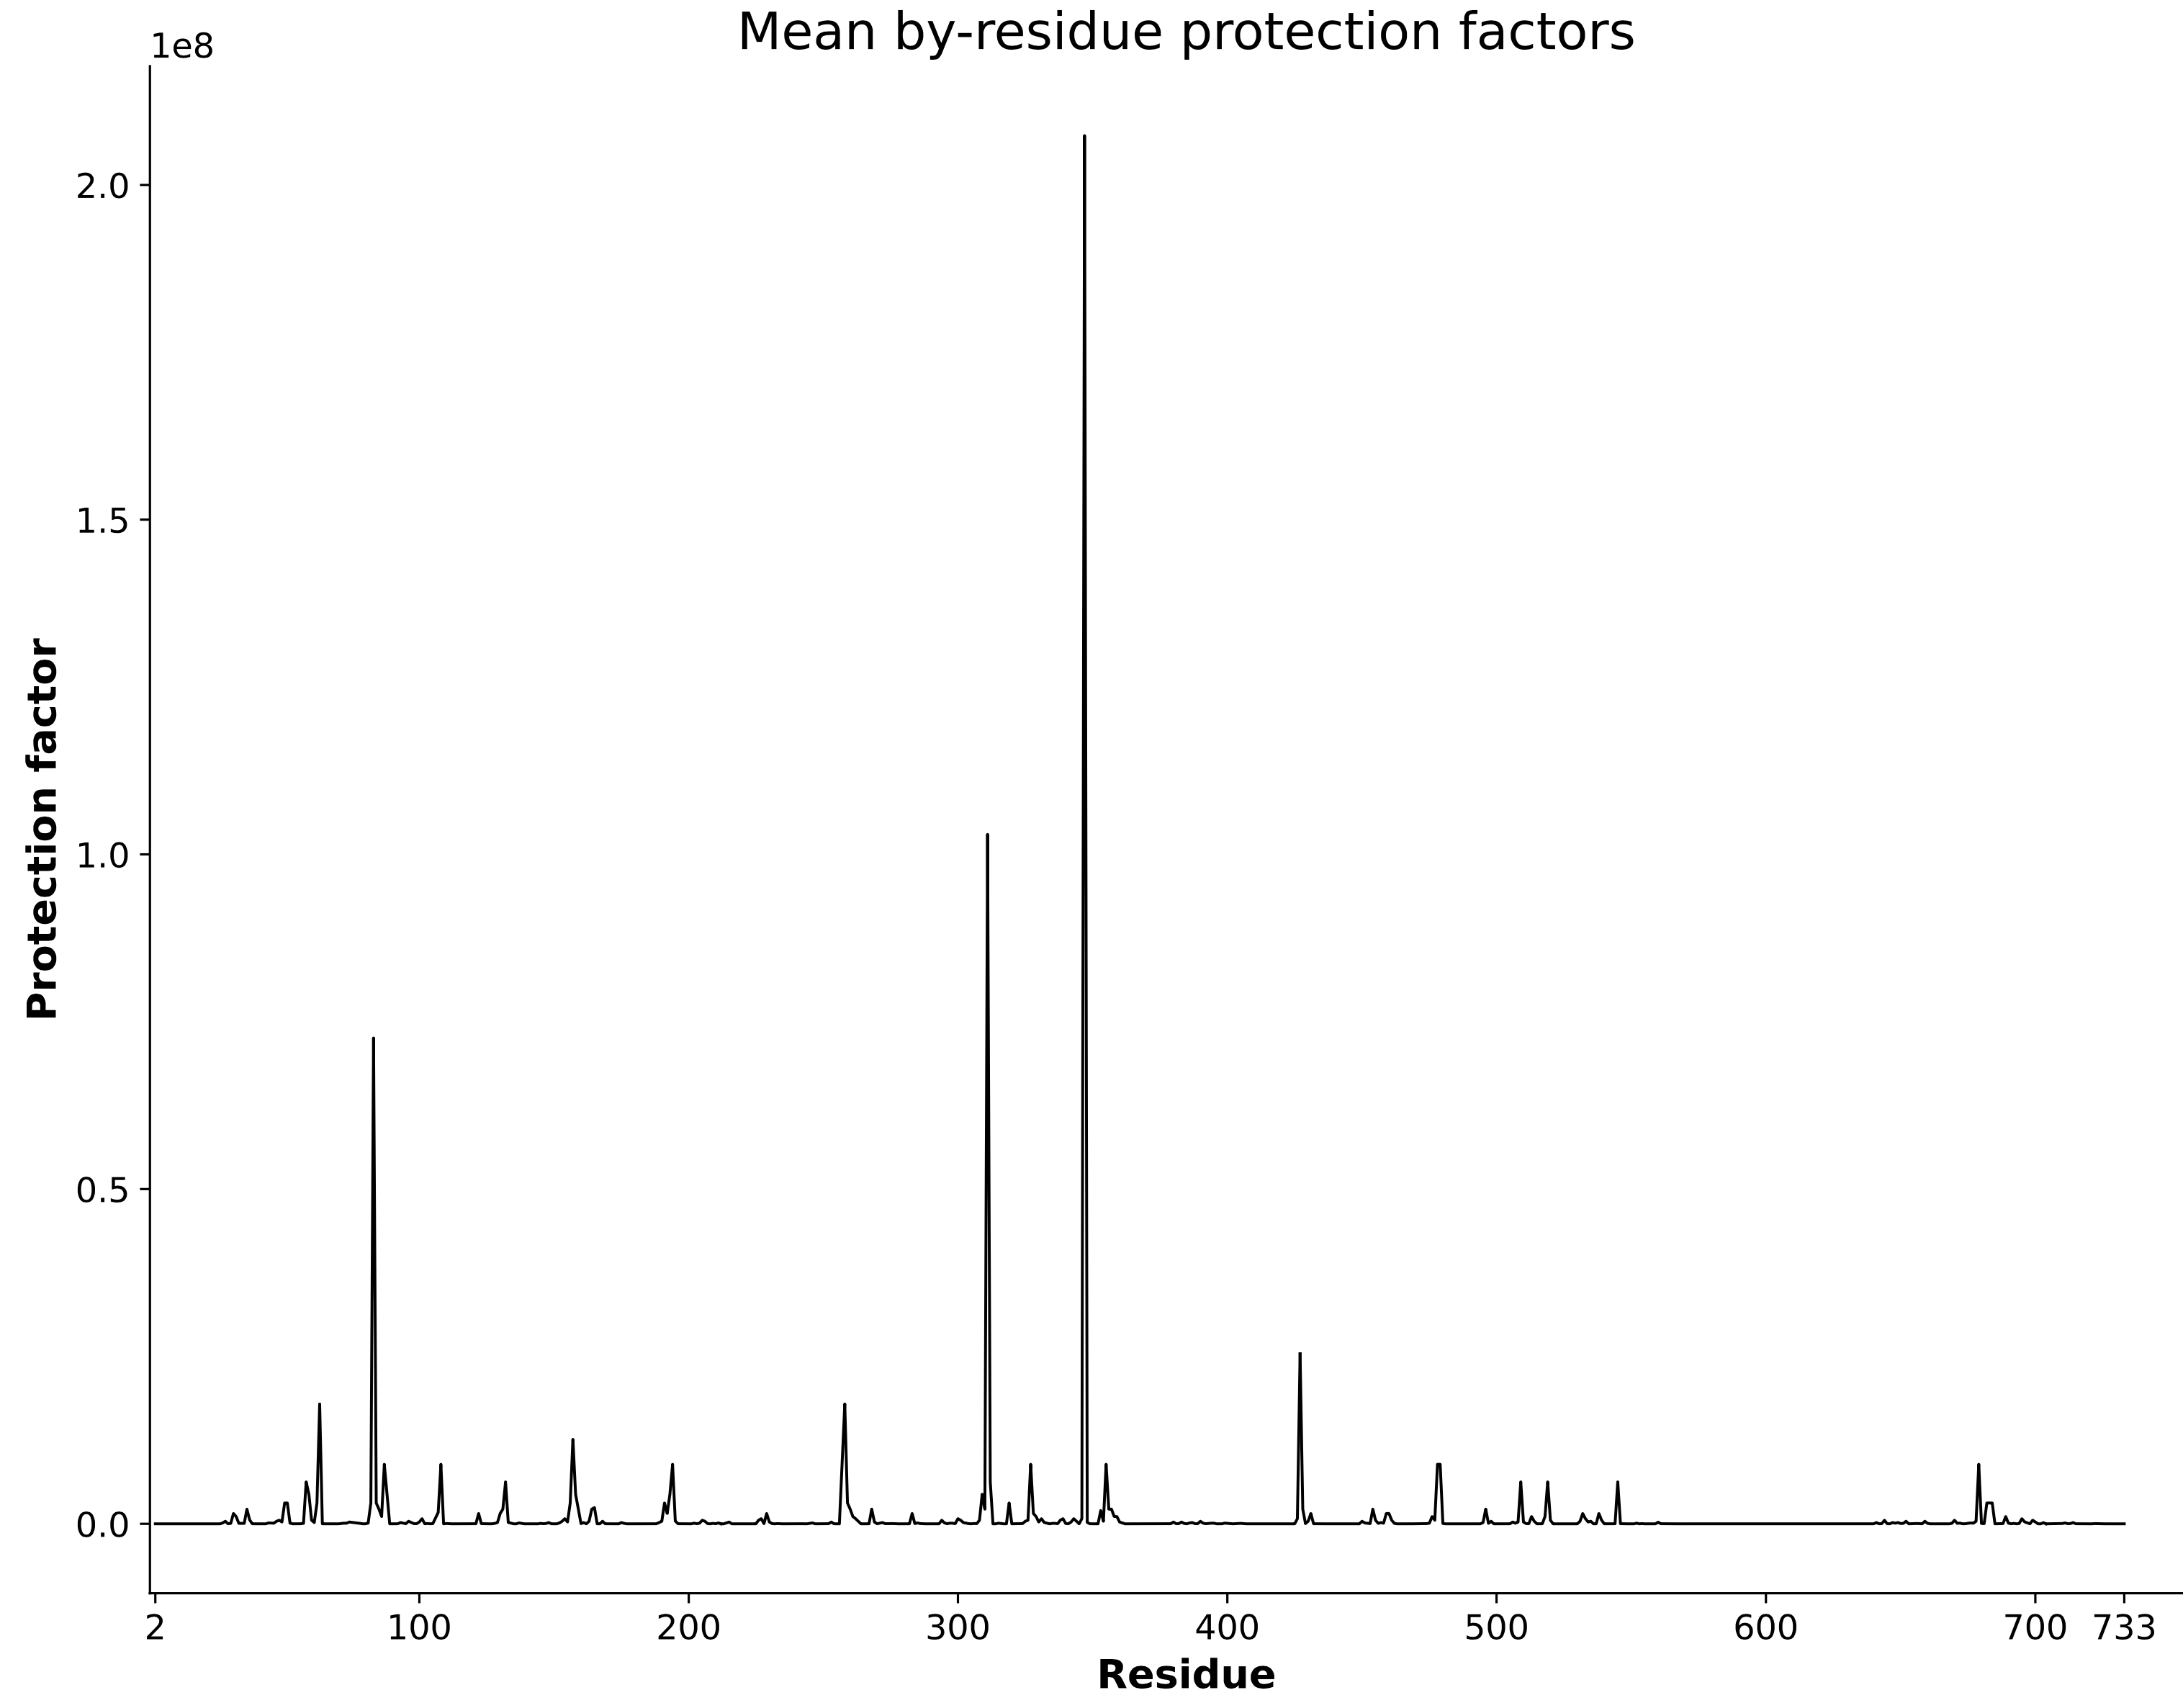
HDXer Pipeline
Correlate external 3D models with your HDX data seamlessly using our integrated HDXer pipeline. Utilize this feature to determine consensus between models, predict protection factors, and achieve more objective interpretations of your HDX data.
Local Bayesian Analysis
Enhance your single amide resolution and deuterium incorporation rate analysis with our software, powered by Bayesian statistics. Perfect for epitope mapping and binding domain studies, all run smoothly on your personal computer.
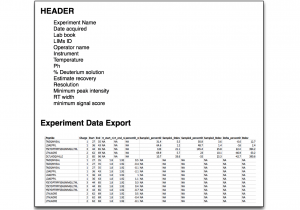
Data Export
Export all underlying data in a single file and generate your own plots or apply statistics. Copy underlying plot data from a group of peptides and paste directly into Prism for advanced statistics and vector graphic plots. Export all uptake plots in a single click. All graphics can be exported.
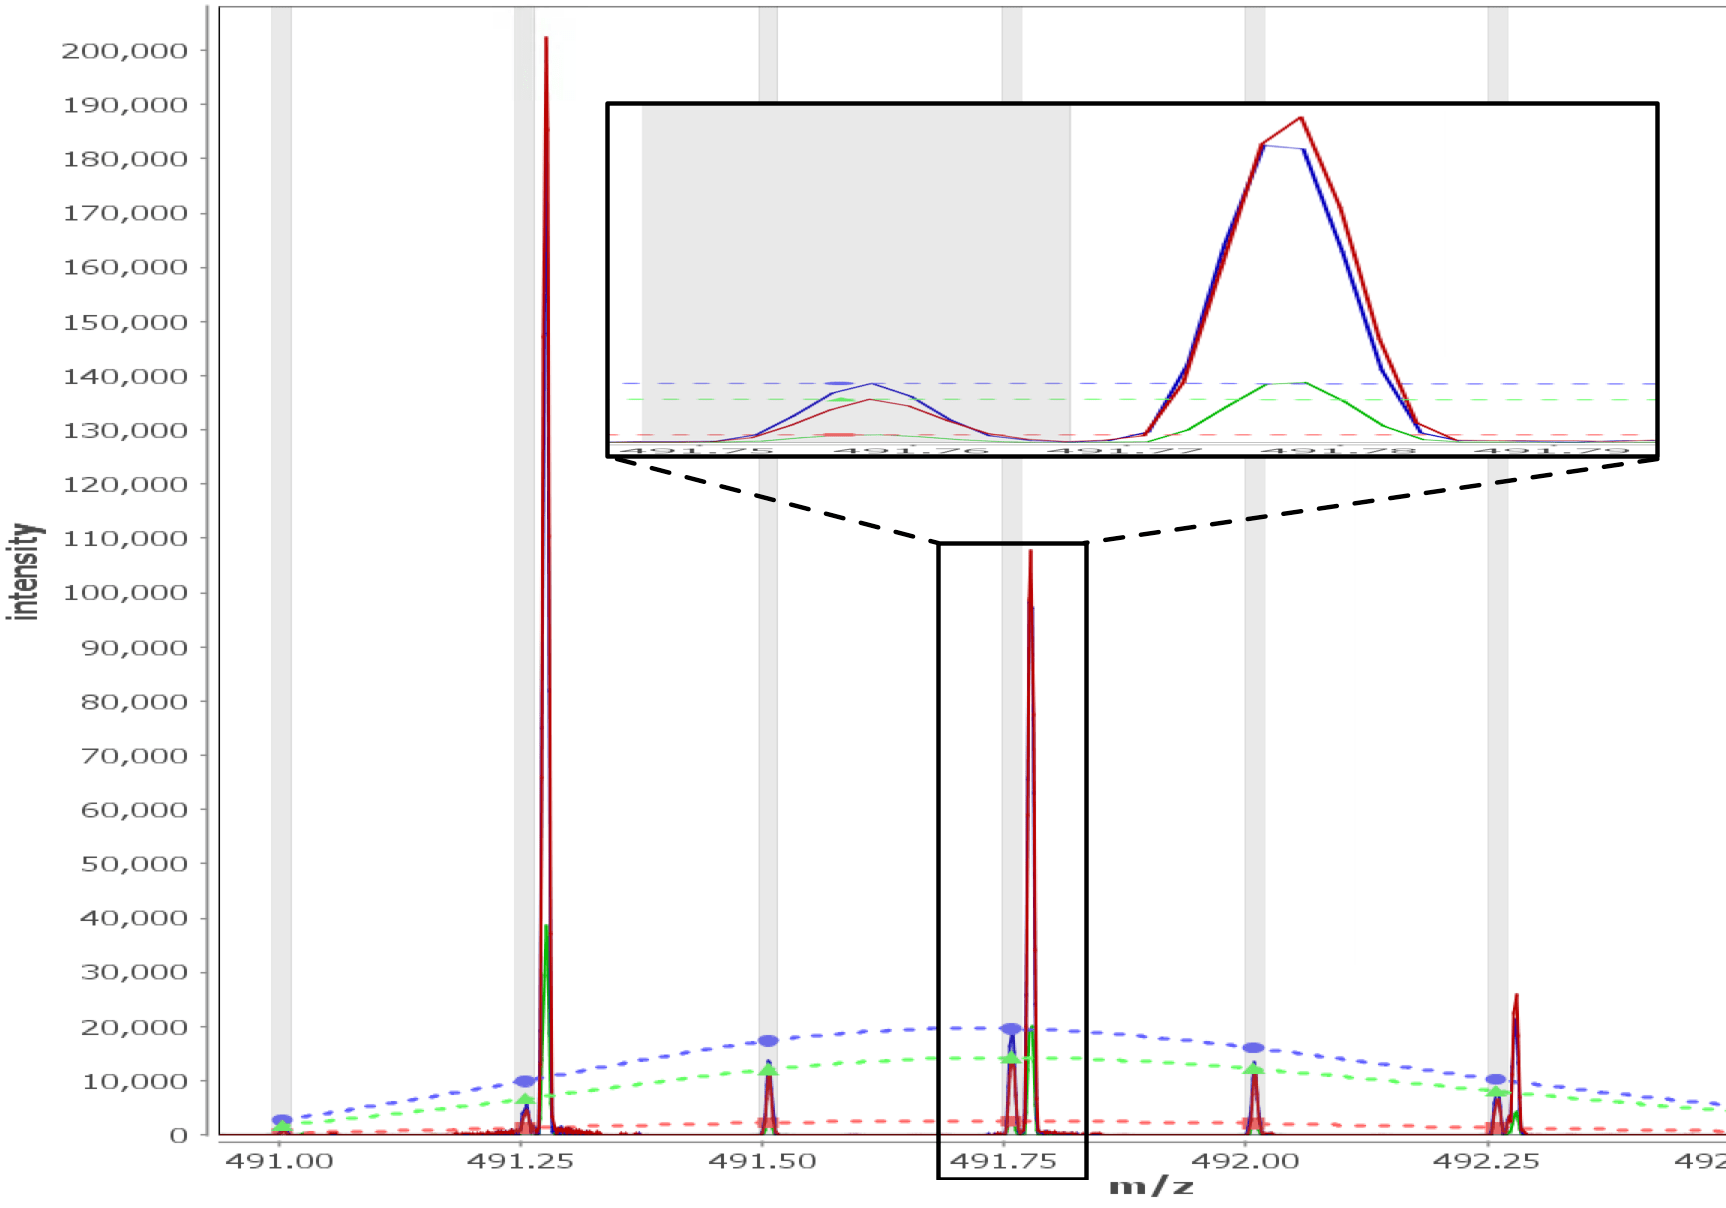
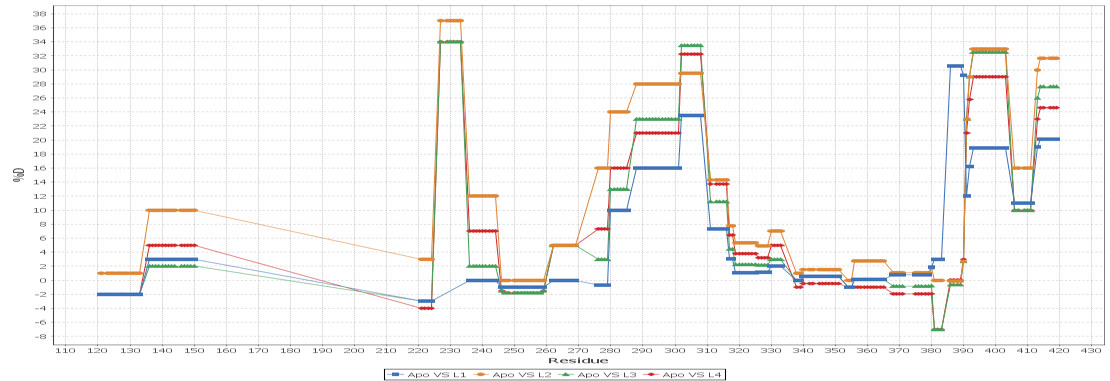
Multi - Spectral View
Load unlimited samples for a given experiment, such as Apo vs. 6 ligands. Select all spectra for a given peptide across samples/replicates, and visually inspect, adjust retention times, mz limits and more for all peptide spectra at once and get through your data much faster than one spectra at a time. View/adjust 100 spectra at the same time. View exactly where peptide peaks are expected, automatically disregard "non-peptide" peaks in convoluted regions, and understand exactly how your centroid calculations are calculated from the averaged mass spectrum using the sub range windows approach.
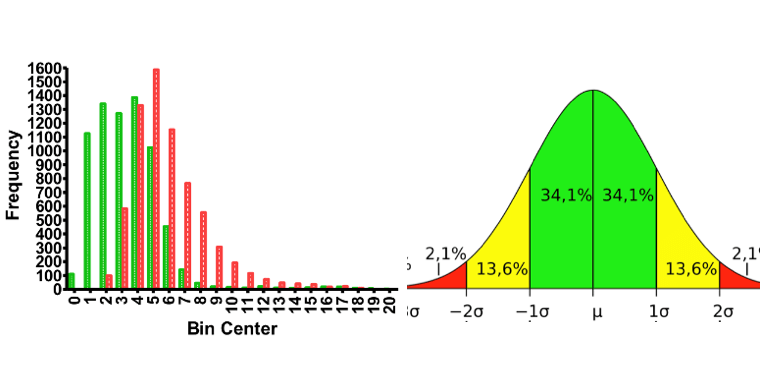
Robust Statistics
Throughout the software robust statistics are relevantly applied for each sample-peptide-charge combination (replicate). In the deuterium uptake plots, p-value results from t-tests between samples are displayed above each time point. Non significant colors are automatically rendered onto heat map data in the sequence coverage and experiment comparison based on statistical tests. The data filter tool allows for the automated discarding/inclusion of peptide replicates based on statistical or fixed thresholds for intensity, score and retention time. This tool can be applied to selected or all peptides, and any combination of parameters is allowed. The peptide replicate will be discarded if it fails any of the tests and included if all tests are passed. Application of these filters allows for the quick identification and removal of outliers removing the need to curate them manually, so users can gain that next step in speed for rapid HDX data analysis.
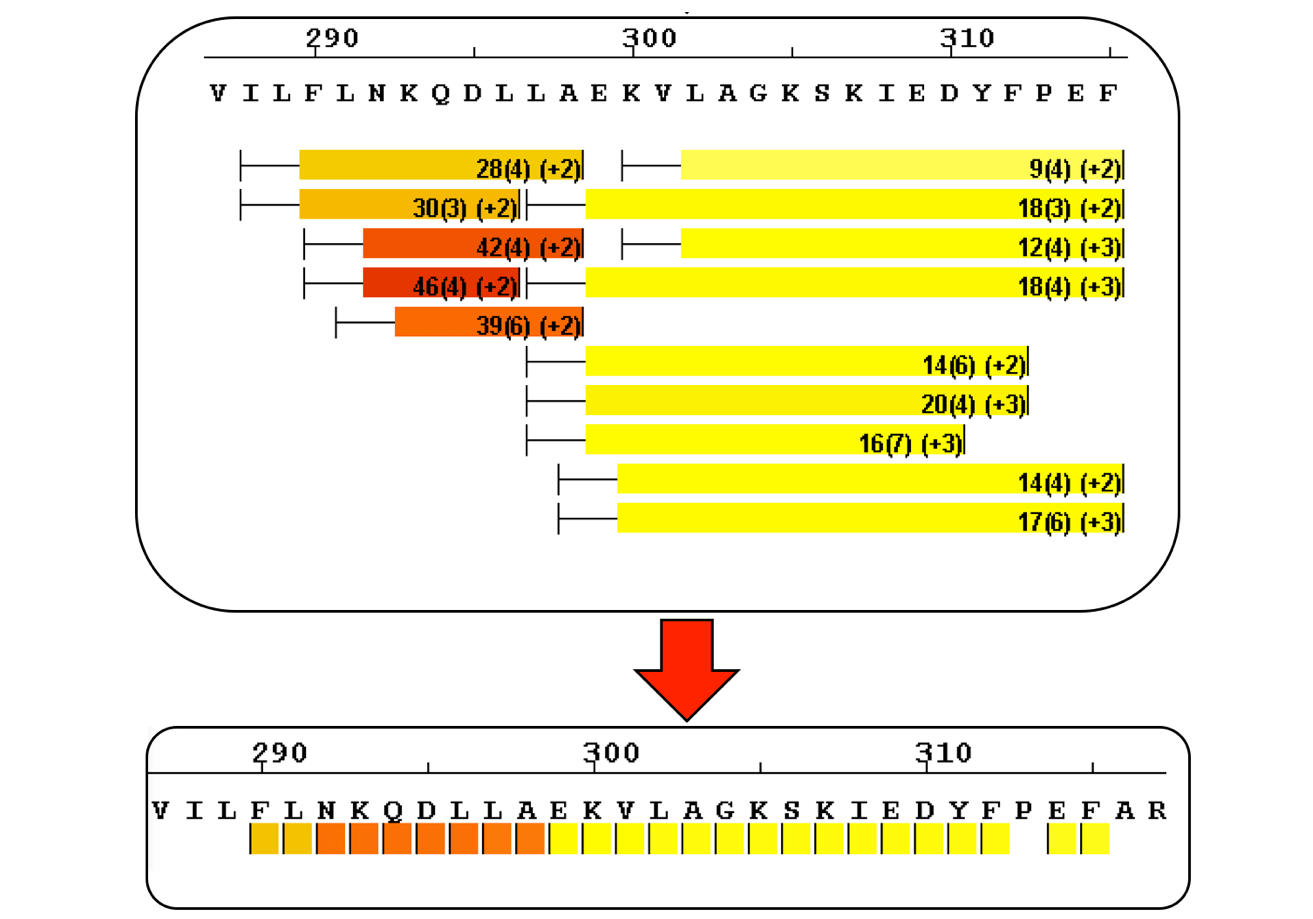
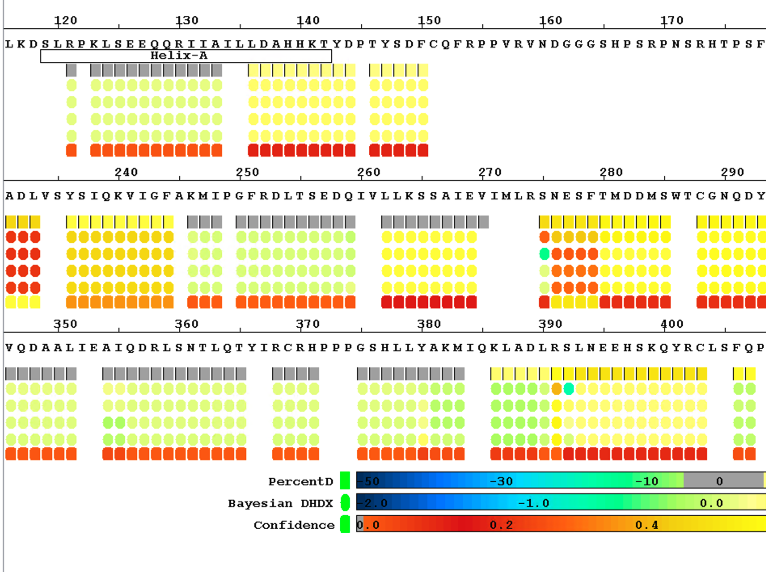
Sequence Coverage Heat Maps with Residue Consolidation
View each peptide/charge separately with fine gradation heat map coloring and values for deuterium incorporation, error and charge. Customize font size, wrap number, bar height and view secondary structure features. View sample heat maps, differential heat maps, stacked heat maps or simple sequence coverage. Consolidate sample or differential data to single amide resolution using multiple established approaches that make sense. Non significant peptides can be colored grey using automated statistical tests.
Hydrogen / deuterium exchange data analysis that makes sense.
SP
Speed
Software improvements have greatly reduced the time it takes to complete data analysis of HDX data but there remains much room for improvement. The statistical filter tool allows for quick and automatic identification and removal of outliers. The bulk discard tool, native library access and ability to curate multiple peptide data simultaneously allows you to get through your data as fast as possible.
AC
Accuracy
Improvements in the detection algorithm have produced more true positive identifications. The spectral view tools provide the means to understand and calculate centroids accurately so you can have confidence in your downstream results.
DE
Design
View your data from the raw spectra to sequence coverage heat maps and tabular views in a way that is relevant. Understand exactly how to get from averaged isotopic envelopes, to centroids, to individual peptides on sequence coverage maps, to residue calculated results in an easy to use interface.
RE
Reports
Presentation is everything when trying to distill information from large data sets. Present your results in sequence coverage heat maps, residue consolidated heat maps across multiple differential experiments, color coded tables or onto a 3D protein structure. View your results in a way that makes sense.