
DIA HDX-MS data analysis
Connect peptide uptake with the fragment evidence behind it. HDX Workbench brings library building, DIA fragment detection, deuteration analysis and spectral review into one workflow.
What does DIA add to HDX-MS analysis?
Data-independent acquisition (DIA) collects fragment-ion spectra across defined mass-to-charge windows. In an HDX-MS experiment, those fragments provide another layer of evidence alongside the intact peptide measurement.
HDX Workbench uses fragment evidence to support peptide detection and retention-time review, then fits fragment deuteration across a fragment series with the precursor measurement as an anchor. The analysis connects the protein sequence to the chromatograms, spectra and fitted results that support each measurement.
New to hydrogen-deuterium exchange mass spectrometry? Start with our HDX-MS workflow and data-analysis overview.
From undeuterated library to fragment uptake
Build the anchor library
Search the undeuterated samples to establish which fragments belong to each peptide and when they elute. An existing anchor library can be reused when appropriate, without rebuilding it for every analysis.
Detect fragments in the labeled samples
Search the deuterated samples against the library to confirm peptides and extract their supporting fragments. Start from the peptide set’s DIA Detect action. HDX Workbench uses OpenSwath for detection and converts files to mzML when required.
Fit fragment deuteration
Estimate fragment uptake from a fitted slope across the fragment series, normalized to the precursor measurement. The workflow follows the AutoHX approach described in the DIA feature notes.
Review the evidence
Use the DIA Quality, MS2 and DIA Diagnostics views to inspect agreement between fragments, retention times and charge states before interpreting the results.
Map DIA fragment coverage onto the sequence
The DIA Fragment Coverage map shows where parent peptides and their quantified b and y fragment ions fall on the protein sequence. It makes the available fragment coverage visible before you interpret uptake patterns.
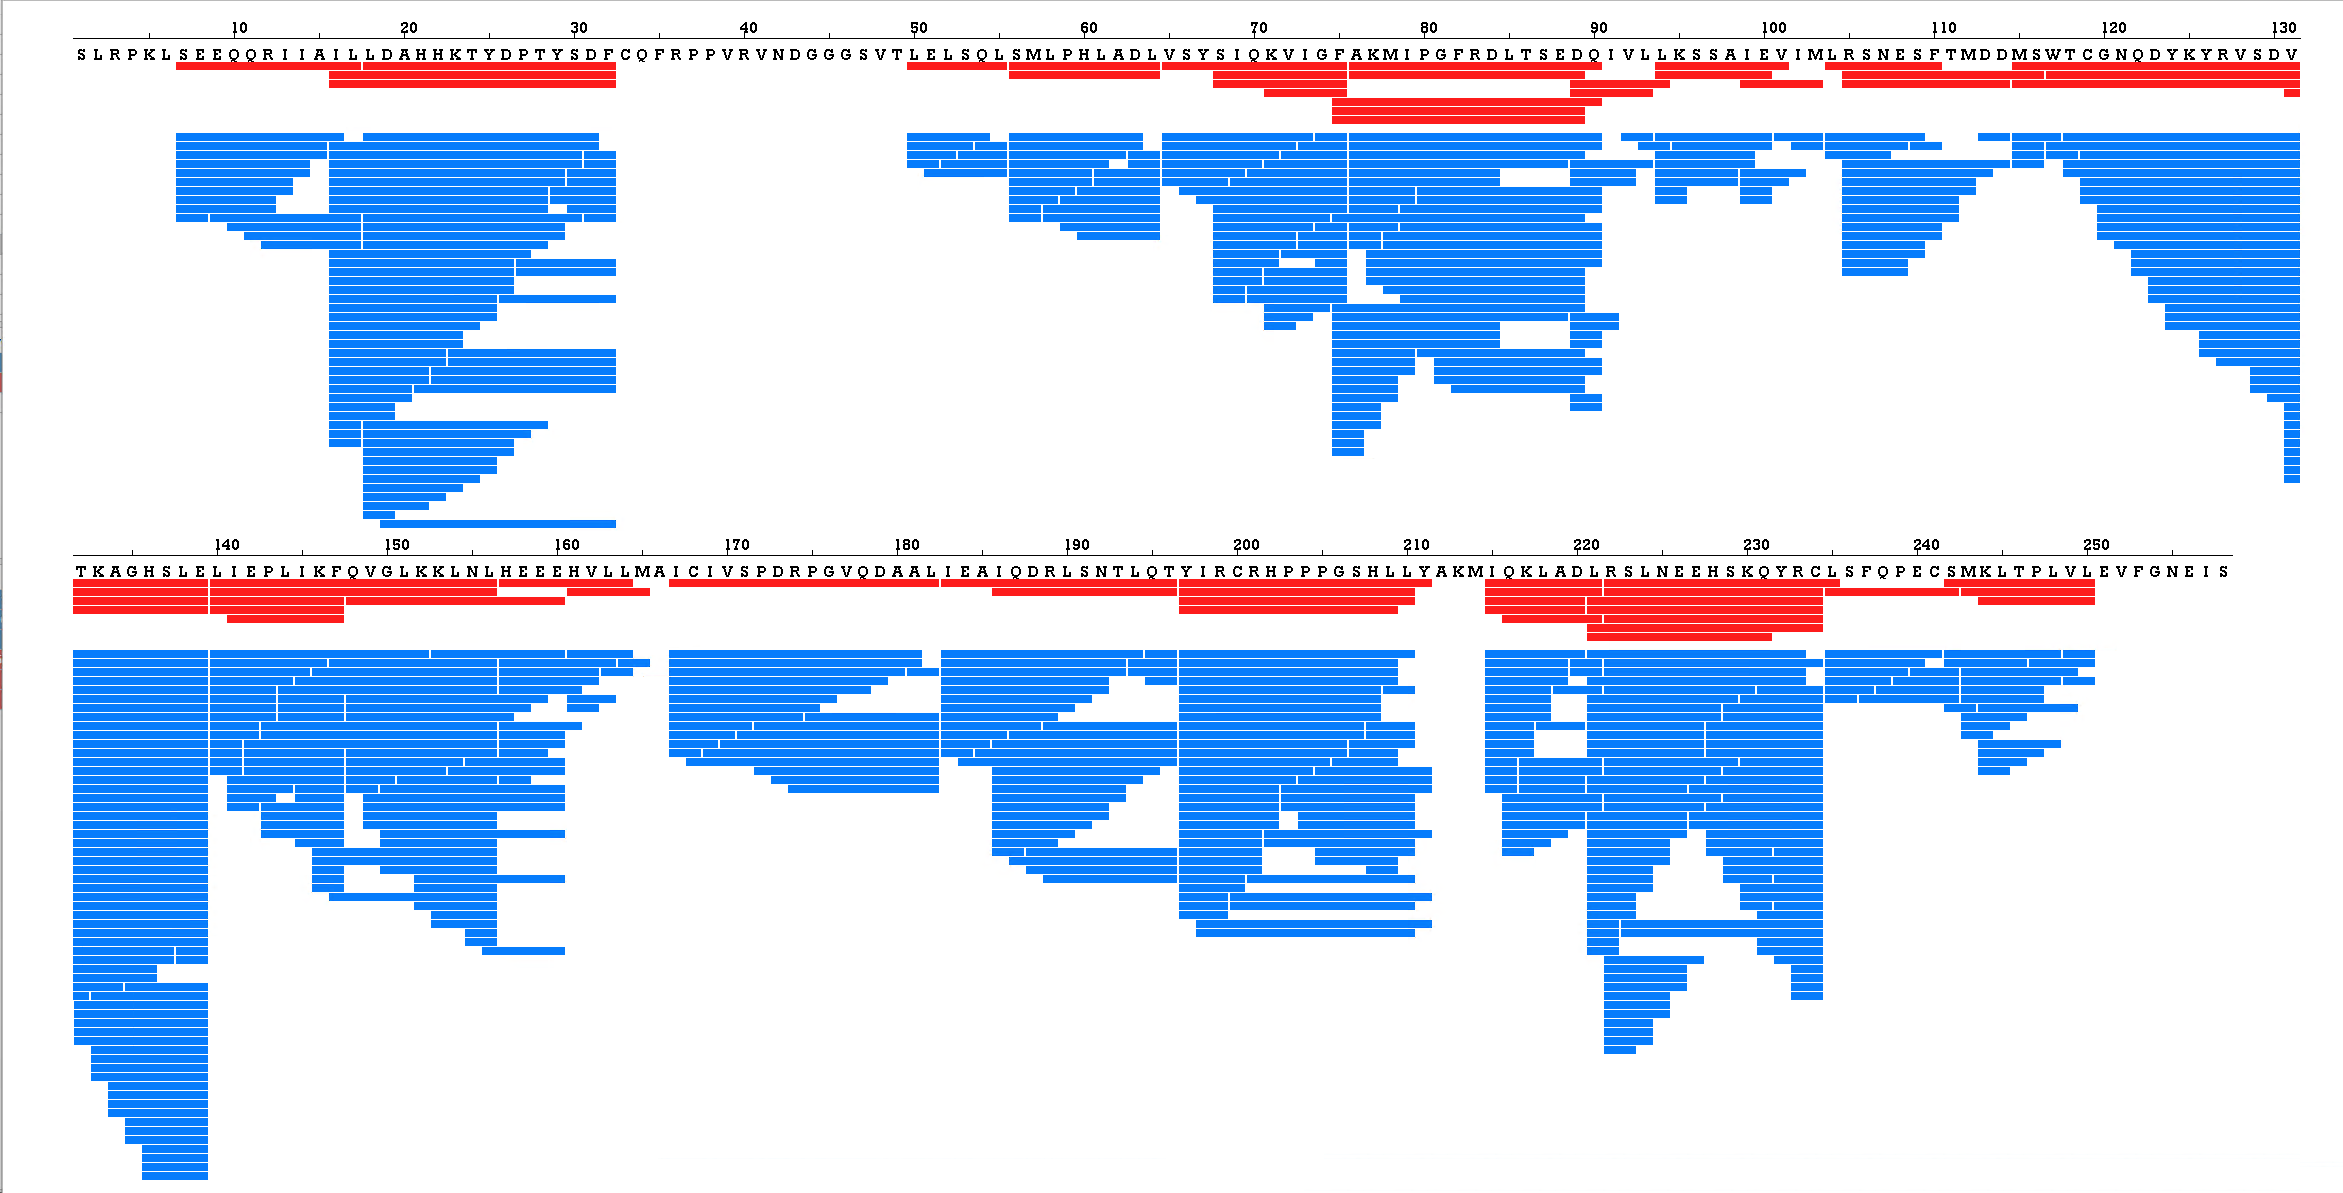
DIA Fragment Coverage for the vitamin D receptor (VDR), VD3 data set. Red: parent peptides measured by DIA. Blue: the b and y fragment ions measured from those peptides, with all replicates combined.
Red bars show parent peptides; blue bars show fragment ions. b ions extend from the peptide’s N terminus and y ions from its C terminus. Replicate observations are merged, so a fragment detected in multiple runs appears once. This view excludes undeuterated and fully deuterated controls and includes quantified fragments beyond those selected for the final value.
Compare MS1 uptake with MS2-validated results
View conventional MS1-derived deuterium uptake alongside MS2-validated fragment-derived results on the same protein sequence. A shared percent-deuteration scale helps you compare the two views while keeping their measurement types distinct.
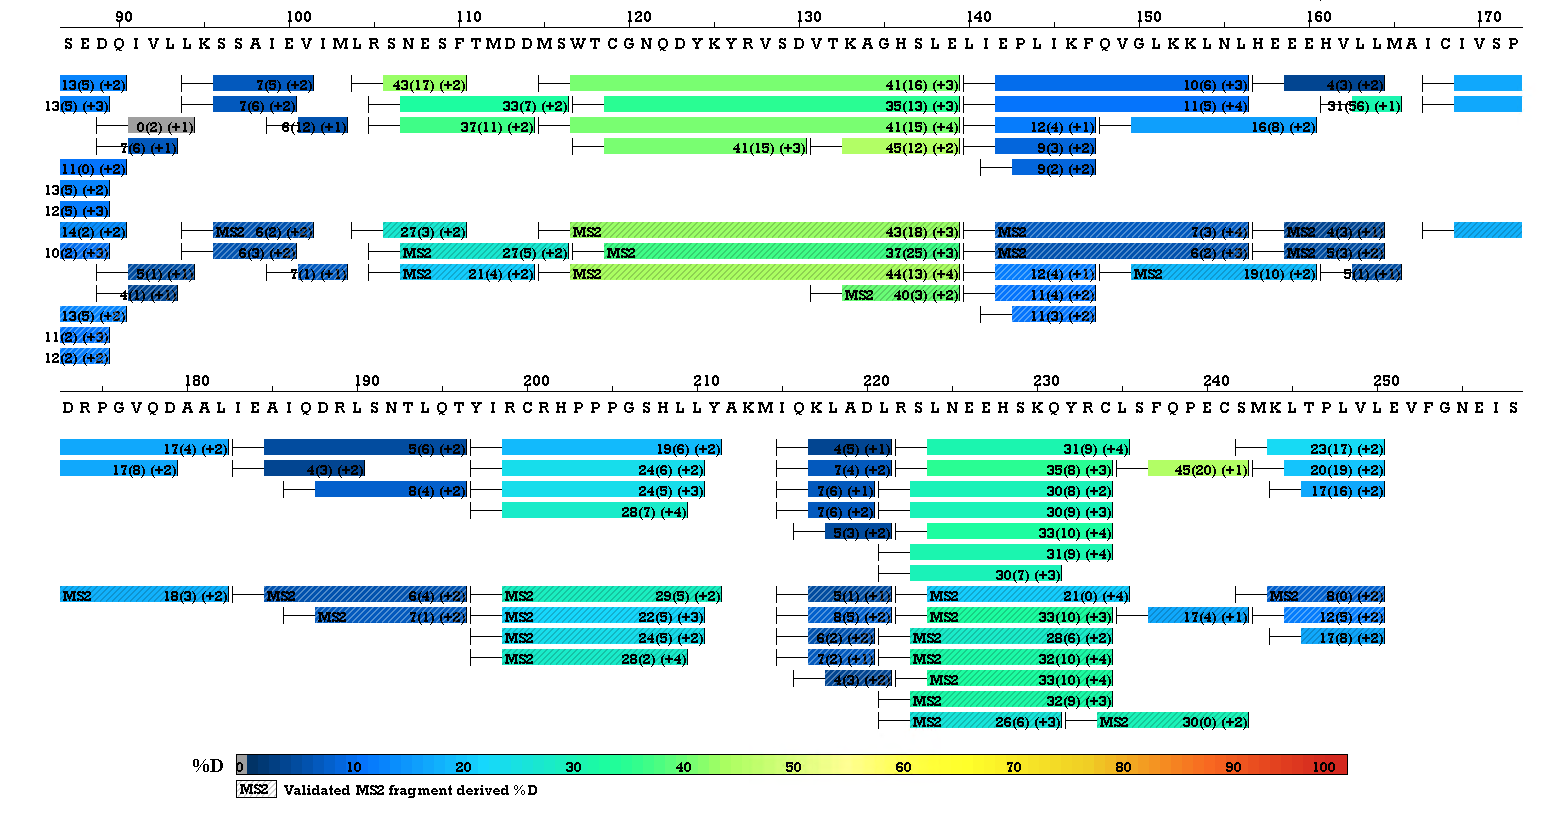
Conventional MS1-derived deuterium uptake is shown alongside validated MS2 fragment-derived %D, aligned to the same protein sequence. Solid bars show the conventional MS1-derived results; hatched bars identify the MS2-validated results. Both use the shared %D colour scale below the map. Click the image to view it at full size.
Read coverage and uptake together. A fragment-coverage map shows where measurements are available; it is not itself an uptake map or evidence of residue-level resolution. Interpret fragment-derived uptake in the context of the acquisition method, controls and quality checks.
Inspect the evidence behind each result
DIA Quality: compare measurements across the experiment
A fragment table and deuteration scatter view help identify disagreement across experimental cells and guide closer inspection.
MS2: follow one replicate at one labeling time
Select a single replicate to inspect the precursor chromatogram, fragment chromatograms, labeled fragment spectrum and fitted deuteration model. The properties sidebar keeps the peptide, deuteration and quality values beside the plots.
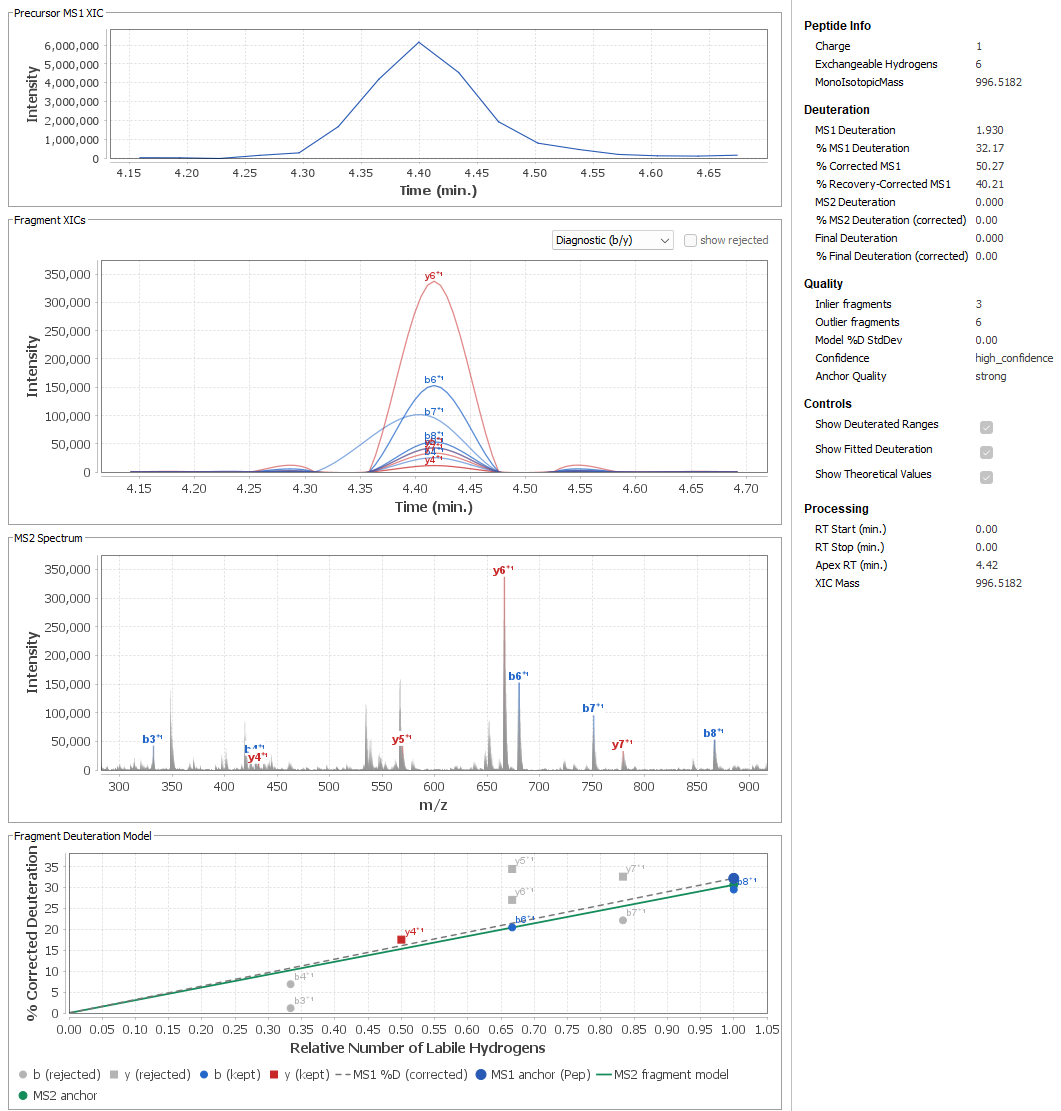
DIA Diagnostics: assess consistency across the run
Review confidence tiers, matched-fragment counts, charge-state agreement and alignment of fragment and precursor retention times. Diagnostics also report proposed retention-window shifts supported by the DIA evidence.
What you need to run the DIA workflow
- DIA-acquired HDX-MS files, including undeuterated samples for the anchor library and labeled samples for uptake analysis.
- A peptide set and an HDX Workbench version that includes the DIA workflow.
- The required OpenMS tools installed for OpenSwath detection. HDX Workbench reports missing tools or non-DIA input before the run proceeds.
- Appropriate experimental controls and replicates for the comparisons you intend to make.
File conversion to mzML is handled when required. To check compatibility with your acquisition method, send us your instrument model, acquisition details and file format.
Explore DIA analysis with your own data
Request a 30-day HDX Workbench trial and tell us about your DIA HDX-MS experiment. We can help you identify the requirements for your workflow.